The File will be in ASCII format read surely in 2 dimensions (an example file can be downloaded).
File to read it is called "baca_data." m ". The Script of this file is as follows,
—————————————- baca_data.m —————————————
#! /usr/bin/octave -qf
fid = fopen(’scen-7.pma’,'r’);
nl = fscanf(fid,’%g %g %g %g %g %g %g %g %gn’,[1 7]);
N = nl(1,1);
M = nl(1,2);
axmin = -2;
axmax = 2;
[x y] = meshgrid(0:100,0:100);
b = fscanf(fid,’%e’,[N M]);
caxis([axmin axmax]);
su(x,y,b);
colormap(’jet’);
colorbar;
axis([0, 100, 0, 100],”ij”);
print surf_octave.png;
—————————————- baca_data.m —————————————
When the file is over run with the command,
abuadnan@abuadnan-laptop:~/Documents$ ./baca_data.m
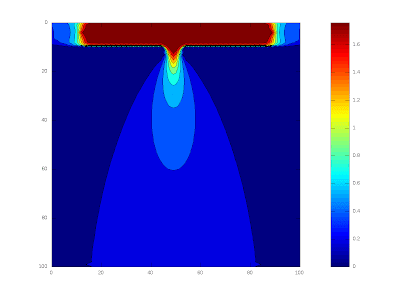
Then it will get the file contourf_octave. png as follows,
Figure 1. Contour Image File generated from a script Octave (baca_data.m)
Figure 1 is a picture generated from a script file with the name Octave "baca_data m" run like the procedure above. Where this script reads the data file in ASCII format with the name "scen-7. foreign direct investment". The File is run and the resulting figure 1 above
So, hopefully this is helpful to all users of linux or windows using the Octave as a free program (free softwares). This example File can be downloaded from here (101,2 Kb)

No comments:
Post a Comment